Creating a Custom 1:1 Weather Forecast Graphic with ChatGPT
Learn how to turn raw weather data into a clean, scroll-stopping graphic for social media or your website using AI + design.
📌 Overview
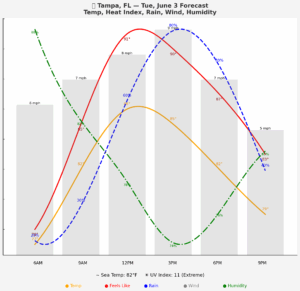
This guide walks through the step-by-step process used to build a clean, social-media-ready weather forecast graphic using ChatGPT and a little Python. The final product is a 1:1 (square) image showing:
- Temperature
- Heat index
- Rain chance
- Wind speed
- Humidity
- Sea temperature
- UV index
🎯 Goals
- Create a visually clean and readable 1:1 weather graph
- Eliminate clutter like gridlines and axis labels
- Include sea temperature and UV index in a visual footer
- Align all elements for easy social sharing
🛠 Step-by-Step Build
1. Gather Weather Data
- Use hourly data for: temperature, heat index, rain chance, wind speed, humidity
- Add daily data for: sea temperature and UV index
- Note: Some data sources only provide 3-hour intervals (e.g. 6AM, 9AM, 12PM, etc.)
2. Define Design Objectives
- Maintain a 1:1 aspect ratio for Instagram or square display
- Use curved lines for smooth data transitions
- Remove vertical and horizontal gridlines
- Place data labels cleanly on or near each point
3. Add Visual Components
- Temperature & Heat Index: orange and red smoothed lines
- Rain Chance: dashed blue line
- Wind Speed: transparent gray bars
- Humidity: green dash-dot line
- Time Labels: centered under each wind bar
- Legend: color-coded at bottom of graph
4. Build a Clean Footer
- Remove axis/grid clutter
- Time labels under wind bars
- Below that: Sea Temp (~) and UV (☀️) shown on one line
- Final row: legend with colored dots and matching labels
5. Final Polish
- Use bold title at the top:
Your City — [Date] Forecast - Adjust subplot padding to fill vertical space
- All footer text aligned using figtext or CSS equivalents
♻️ Tips for Reusability
- Swap in any location and date
- Re-use the same layout and styling for brand consistency
- If using limited data (3-hour intervals), adjust timing labels accordingly
- Stick to a minimalist layout for readability and clarity
✨ Optional Additions
- Animated version for Instagram Stories
- Embed emoji/icons for sea and sun vibes
- Export as high-res PNG for better clarity
✅ Conclusion
With just a little AI help and style guidance, you can create stunning weather visuals tailored to your brand, platform, or community. Whether you're posting to Instagram or updating your site, this layout helps your forecast stand out and stay clean.
Have questions or want a custom version for your town? Drop a comment!
⚡ Get Your Own Weather Graphic
Want a personalized version of this graphic for your city?
Just copy and paste the following prompt into ChatGPT:
Use the WXGraph Template with 1:1 format.
Include: curved lines for temp, feels like, rain, humidity;
bars for wind; no grid; centered time labels below each bar;
footer with ~ sea temp and ☀️ UV index; final legend on one line.
Or use this shortcut:
#wxgraph for [Your City] on [Date]
Example:
#wxgraph for Clearwater Beach on Friday
This tells ChatGPT to use the exact layout and visual style described in this post — no extra instructions needed.